Abstract
Background: Drug resistance is a major challenge for the treatment of high-grade serous ovarian carcinoma (HGSOC), frequently leading to disease recurrence and therapeutic failure.
Objective: This study investigated the cellular phenotypic and molecular bases of drug resistance in human ovarian cancer cell line such as OVCAR4.
Method: The chlorpromazine (CPZ) and metformin repurposed drugs were used for the treatment of ovarian cancer cells to follow the treatment response, and the hemocytometer and clonogenic assay were used, followed by the ANOVA and Tukey’s HSD post hoc test for statistical analysis. Surviving cell populations were recognized as drug resistant and further analysed at the molecular level. The OVCAR4 cells were used for RNA isolation and then converted into cDNA and used for real-time PCR, and PCR amplicons were verified by gel electrophoresis
Results: The molecular results were linked to the observable outcomes from the hemocytometer and clonogenic assay after drug treatment.
Conclusion: The research study provides a drug resistance-related inclusive analysis in ovarian cancer. Cellular and molecular analyses provide in vitro identification of resistance-associated markers and open a future path for therapeutic approaches to overcome drug resistance in ovarian cancer.
Keywords: HGSOC, OVCAR4, CPZ, Metformin, Drug Resistance
Introduction
The most lethal gynecological malignancy is ovarian cancer, and it is the fifth leading cause of cancer-related death among women worldwide. The HGSOC is the most aggressive subtype of ovarian cancer, with a high mortality rate and late diagnosis. In the last few years, the drug repurposing approach has improved the effectiveness of chemotherapy and targeted the resistant cancer cells through alternative pathways. Metformin is one of the drugs used for type 2 diabetes and shows anticancer activity in different tumor models, including ovarian cancer. The metformin is used to reduce the ovarian cancer cell proliferation and improve the sensitivity [1-6].
Chlorpromazine (CPZ) is an antipsychotic drug and is used to treat psychiatric and neurological disorders, clinically it is used for schizophrenia and has an anticancer potential. CPZ interrupts the drug efflux mechanism and exposes reverse resistance to chemotherapeutics by down regulating MDR1 expression. The specific properties of CPZ make it a promising contender for group therapy in resistant ovarian cancer [7-12].
Despite progress, the drug resistance in ovarian cancer for molecular mechanisms remains incompletely understood. Traditional assays like hemocytometer and clonogenic assays based on cell counting and colony formation are used for short and long-term drug effects respectively, but do not expose the gene-level changes. Nucleic acid-based molecular diagnostic techniques such as real-time polymerase chain reaction (PCR) and agarose gel electrophoresis were used to detect drug resistance in a fast and sensitive manner and no change was observed in the targeted gene [13-21].
The study engaged with a joined strategy to evaluate ovarian cancer cell lines like OVCAR4 of HGSOC. The cells were treated with CPZ and metformin individually and combined to assess the effects and resistance profile. The hemocytometer was used for counting the cells, and the clonogenic assay defined the cell proliferation and survival further ANOVA and Tukey’s HSD post hoc test was used for statistical analysis, while molecular analyses were performed to detect drug resistance and check the drug impact.
Method
The OVCAR4 cell line was purchased from ATCC. The RPMI-1640 (Gibco, Thermo Fisher Scientific, USA) medium with 10% fetal bovine serum (FBS; Gibco, Thermo Fisher Scientific, USA) and 1% penicillin-streptomycin (Gibco, Thermo Fisher Scientific, USA). The cells were maintained at 37 °C in an incubator with 5% CO₂.
Drug treatment for OVCAR4 cells
CPZ (≥ 98% purity, Sigma-Aldrich, USA) and metformin (≥ 98% purity, Sigma-Aldrich, USA) stock solutions were prepared and stored at -20 °C, while final concentrations were prepared freshly, and cells were seeded in 6-well plates. On the first day, at the cell suspension stage, remove the supernatant and add 0.6 ml RPMI-1640 medium with the remaining cell pellet in the falcon tube. After that, 0.5 ml of RPMI-1640 medium was put in each well of the 6-well plate, and 100 µl from the cell suspension taken from the falcon tube was added. It was mixed gently, and the cells were observed on a fluorescent microscope, then kept in the incubator overnight. On day two, first remove last night's culture medium and add 1 ml of fresh medium. After that, one well of each set was used for control, while the other was used for 0.5 µM CPZ of 10 µl, 2 µM metformin of 10 µl, and one was a combo (metformin + CPZ). After that, each well was observed on a fluorescent microscope and then kept in the incubator for 48 hours.
On the fourth day, remove the medium, then add PBS (Gibco, Thermo Fisher Scientific, USA) three times in each well to wash it out, then add 0.25% Trypsin-EDTA (Thermo Fisher Scientific, USA) 0.5 ml and incubate for 5 minutes in the incubator. Checked the cells condition, the cells were floating, then added 1 ml of RPMI-1640 medium and mixed it smoothly in the falcon tube. The P100 cell plates were taken for each well separately and put in 10.5 ml of fresh RPMI-1640 medium, and 1.5 ml was taken from the falcon tube cell suspension and mixed vigorously. The total volume was 12 ml. The cells were floating to check on the fluorescent microscope, and the P100 plates were kept in the incubator for 72 hours.
Hemocytometer
A hemocytometer was performed to count the OVCAR4 cells during cell suspension at day 1 and day 4. At the stage of cell suspension, first remove the supernatant, the cell pellet remains in the falcon tube, then add 1 ml of RPMI-1640 medium and mix it gently. After that, take parafilm, put 10 µl of cells of cell suspension on the parafilm and 10 µl of trypan blue (Gibco, Thermo Fisher Scientific, USA), mix it vigorously, then take 10 µl to insert in the hemocytometer and check on the fluorescent microscope. The hemocytometer should be covered with a glass slide. Dead cells appeared blue, while live cells remained unstained and displayed a uniform transparent appearance.
Clonogenic assay
The OVCAR4 cells were treated with repurposed drugs for 48 hours, then the cells were replaced into P100 plates for the next three days and incubated without disturbing the colonies. After that, gently rinse with PBS three times and fix the cells with methanol (100%) for 10 minutes, then discard the methanol (Sigma-Aldrich, USA) and add 0.5% crystal violet (Sigma-Aldrich, USA) to stain the colonies and incubate for around 15 minutes at room temperature, rinse gently, and remove the stain using tap water carefully. The plates were completely air-dried, and colonies were counted manually under a fluorescent microscope, with 50 or more cells counted per colony. The formula implemented for plating efficiency (PE) for control untreated colonies and surviving fraction (SF) for treated colonies.
RNA extraction
For cell collection, wash OVCAR4 cells with cold PBS, lyse directly, and use TRIzol (Thermo Fisher Scientific, USA), while homogenizing with a pipette. For phase separation, add 200 µl chloroform (Sigma-Aldrich) per 1 ml TRIzol. For 15 seconds shake vigorously and incubate 2-4 minutes at room temperature. At 4 °C, centrifuge at 12000 x g for 12 minutes. For RNA precipitation, take a new tube to transfer the upper aqueous layer, add 500 µl isopropanol, and incubate at room temperature for 8 minutes. Centrifuge at 12000 x g at 4 °C for 8 minutes, then wash the pellet with 1 ml ethanol (75%) and discard the supernatant. Vortex and centrifuge at 7500 x g at 4 °C for 3 minutes. For RNA suspension, shortly air-dry the pellet and dissolve in 30-50 µl of RNase-free water. Measured the concentration at NanoDrop and stored at -80 °C.
Primer designing
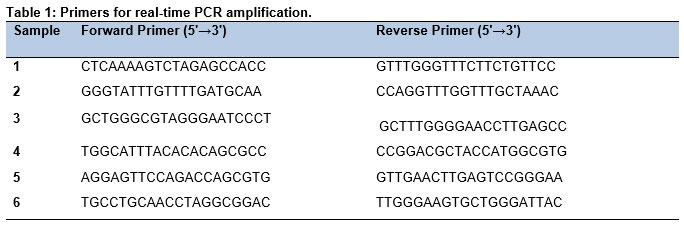
Primers targeting the TP53 gene were used for real-time PCR amplification, and the accession number was NC_000017.11.
Real time PCR protocol
To quantify the mRNA expression of target genes, used cDNA generated from RNA via reverse transcription using the SuperScript IV VILO Master Mix. Real-time PCR or qPCR, protocol was used with SYBR green dyes. The reaction setup was designed as SYBR green master mix (2x) 10 µl, forward primer (10 µM) 0.8 µl, reverse primer (10 µM) 0.8 µl, cDNA template 2 µl, and nuclease-free water 6.4 µl, while the total volume was 20 µl. Thermal cycling conditions included an initial denaturation was 95 °C for 3 minutes, followed by denaturation was 95 °C for 15 seconds, annealing and extension were 60 °C for 30 seconds. Many SYBER green master mix were optimized two-step reactions. While the melt curve was an optional at 60-95 °C for 5 seconds hold at each temperature increment.
Gel electrophoresis
Prepared 1.7% agarose gel in 1x TBE buffer and heated until dissolved, cooled to 60 °C and added a nucleic acid stain as per the manufacturer's instructions, poured it into the casting tray, and inserted the comb to allow it to solidify for 15 minutes. Place the gel in an electrophoresis tank, cover with 1x running buffer and remove the comb. Mix the sample with loading dye and spin down shortly. The molecular ladder with the sample was put in separate wells without puncturing the gel and run for 30 minutes at 120 volts. The band was visualized on the gel imaging system and the expected size of 100 bp of the ovarian cancer samples were confirmed and compared with the DNA ladder (GeneRular 100 bp DNA Ladder, Thermo Scientific, USA).
Results
Drugs Repurposing strategy in ovarian cancer
The CPZ and metformin validated cell viability in primary screening for OVCAR4 cell lines. The drug was consistent in each sample and exposed with less cytotoxicity. The repurposing of drugs CPZ and metformin individually was impactful, while combo (CPZ + metformin) had better outcomes. The hemocytometer was performed on day 1 during cell suspension when cells were seeding and on day 4 during cell suspension when cells were transferred into P100 plates.
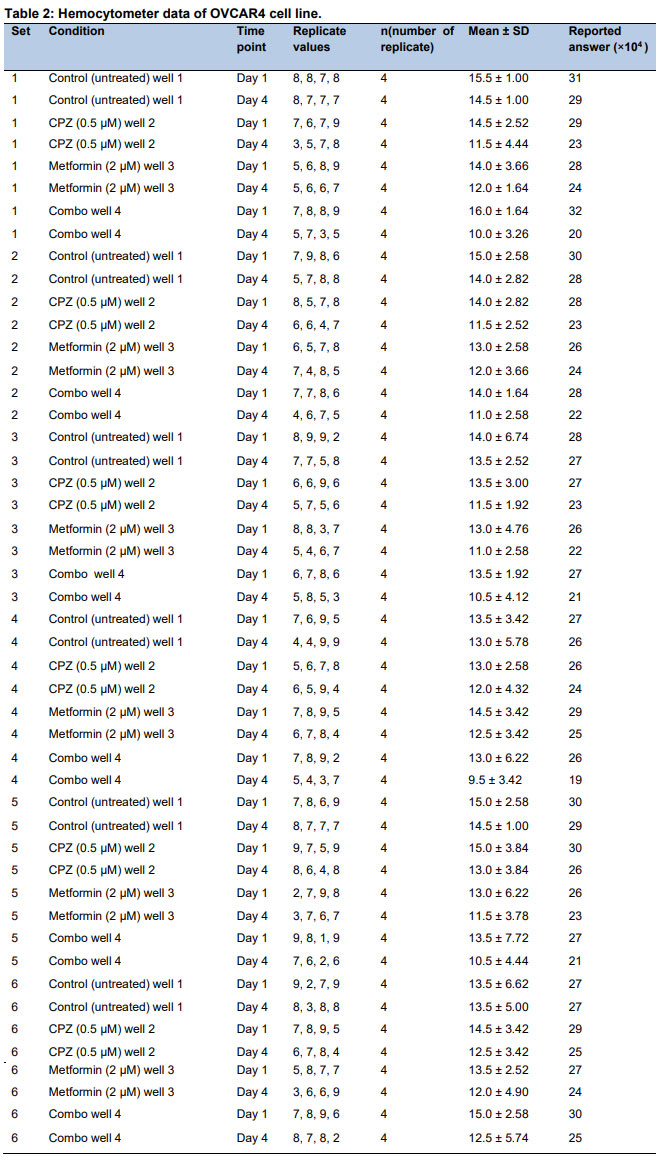
The hemocytometer data Table 2 assessments the different treatment effects, like CPZ (0.5 µM), metformin (2 µM), and their combination, for the cell proliferation inhibition. For the OVCAR4 cell line, cell counts were measured during cell suspension (day 1), and the next time a hemocytometer was used during cell suspension when cells were transferred into P100 plates (day 4). The hemocytometer data Table 2 provides the mean and standard deviation (SD) for each condition and displays variability between replicates. Controls (untreated) from day 1 to day 4 maintained stable cell numbers, while in treatment with CPZ, metformin and combo, outcomes showed a cell proliferation reduction, but the combo had a greater cell reduction as compared to the single drug. The SD points out some variability in response, but overall data demonstrate that both single and combined drug treatments reduce the cell proliferation, while the combined treatments were more effective as compared to individual drugs.
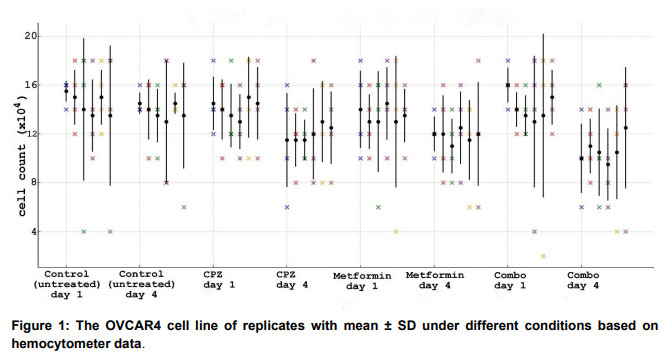
The scatter plot displayed the mean cell counts for each cell condition and time point. The error bars represented the standard deviation (SD) of the replicates. Each point corresponds to a mean from four replicates, and the error bars illustrate the variability in cell counts across the replicates. The scatter plot of Figure 1 was used to compare day 1 and day 4. Each set was assigned a fixed color across all treatments, like set 1 (blue), set 2 (red), set 3 (green), set 4 (purple), set 5 (orange), and set 6 (brown). The black circles with error bars display the mean ± SD for each set. The black error bar marker indicates the mean and variability of the replicate under each treatment. Figure 1 was generated from the original data in Table 2.
Clonogenic survival reflects long term drug resistance
Clonogenic assays were executed after drug treatment to evaluate the capability of cells to retain their proliferative ability. The untreated control in the ovarian cancer cell line formed dense and well-defined colonies. When CPZ and metformin were applied individually, a mild reduction in colony number and size was observed. Though combined (CPZ + metformin) treatment managed significantly lower colonies as compared to CPZ and metformin. The synergistic mechanism indicated that CPZ and metformin sensitize the cells, but the later phase backs the drug resistance.
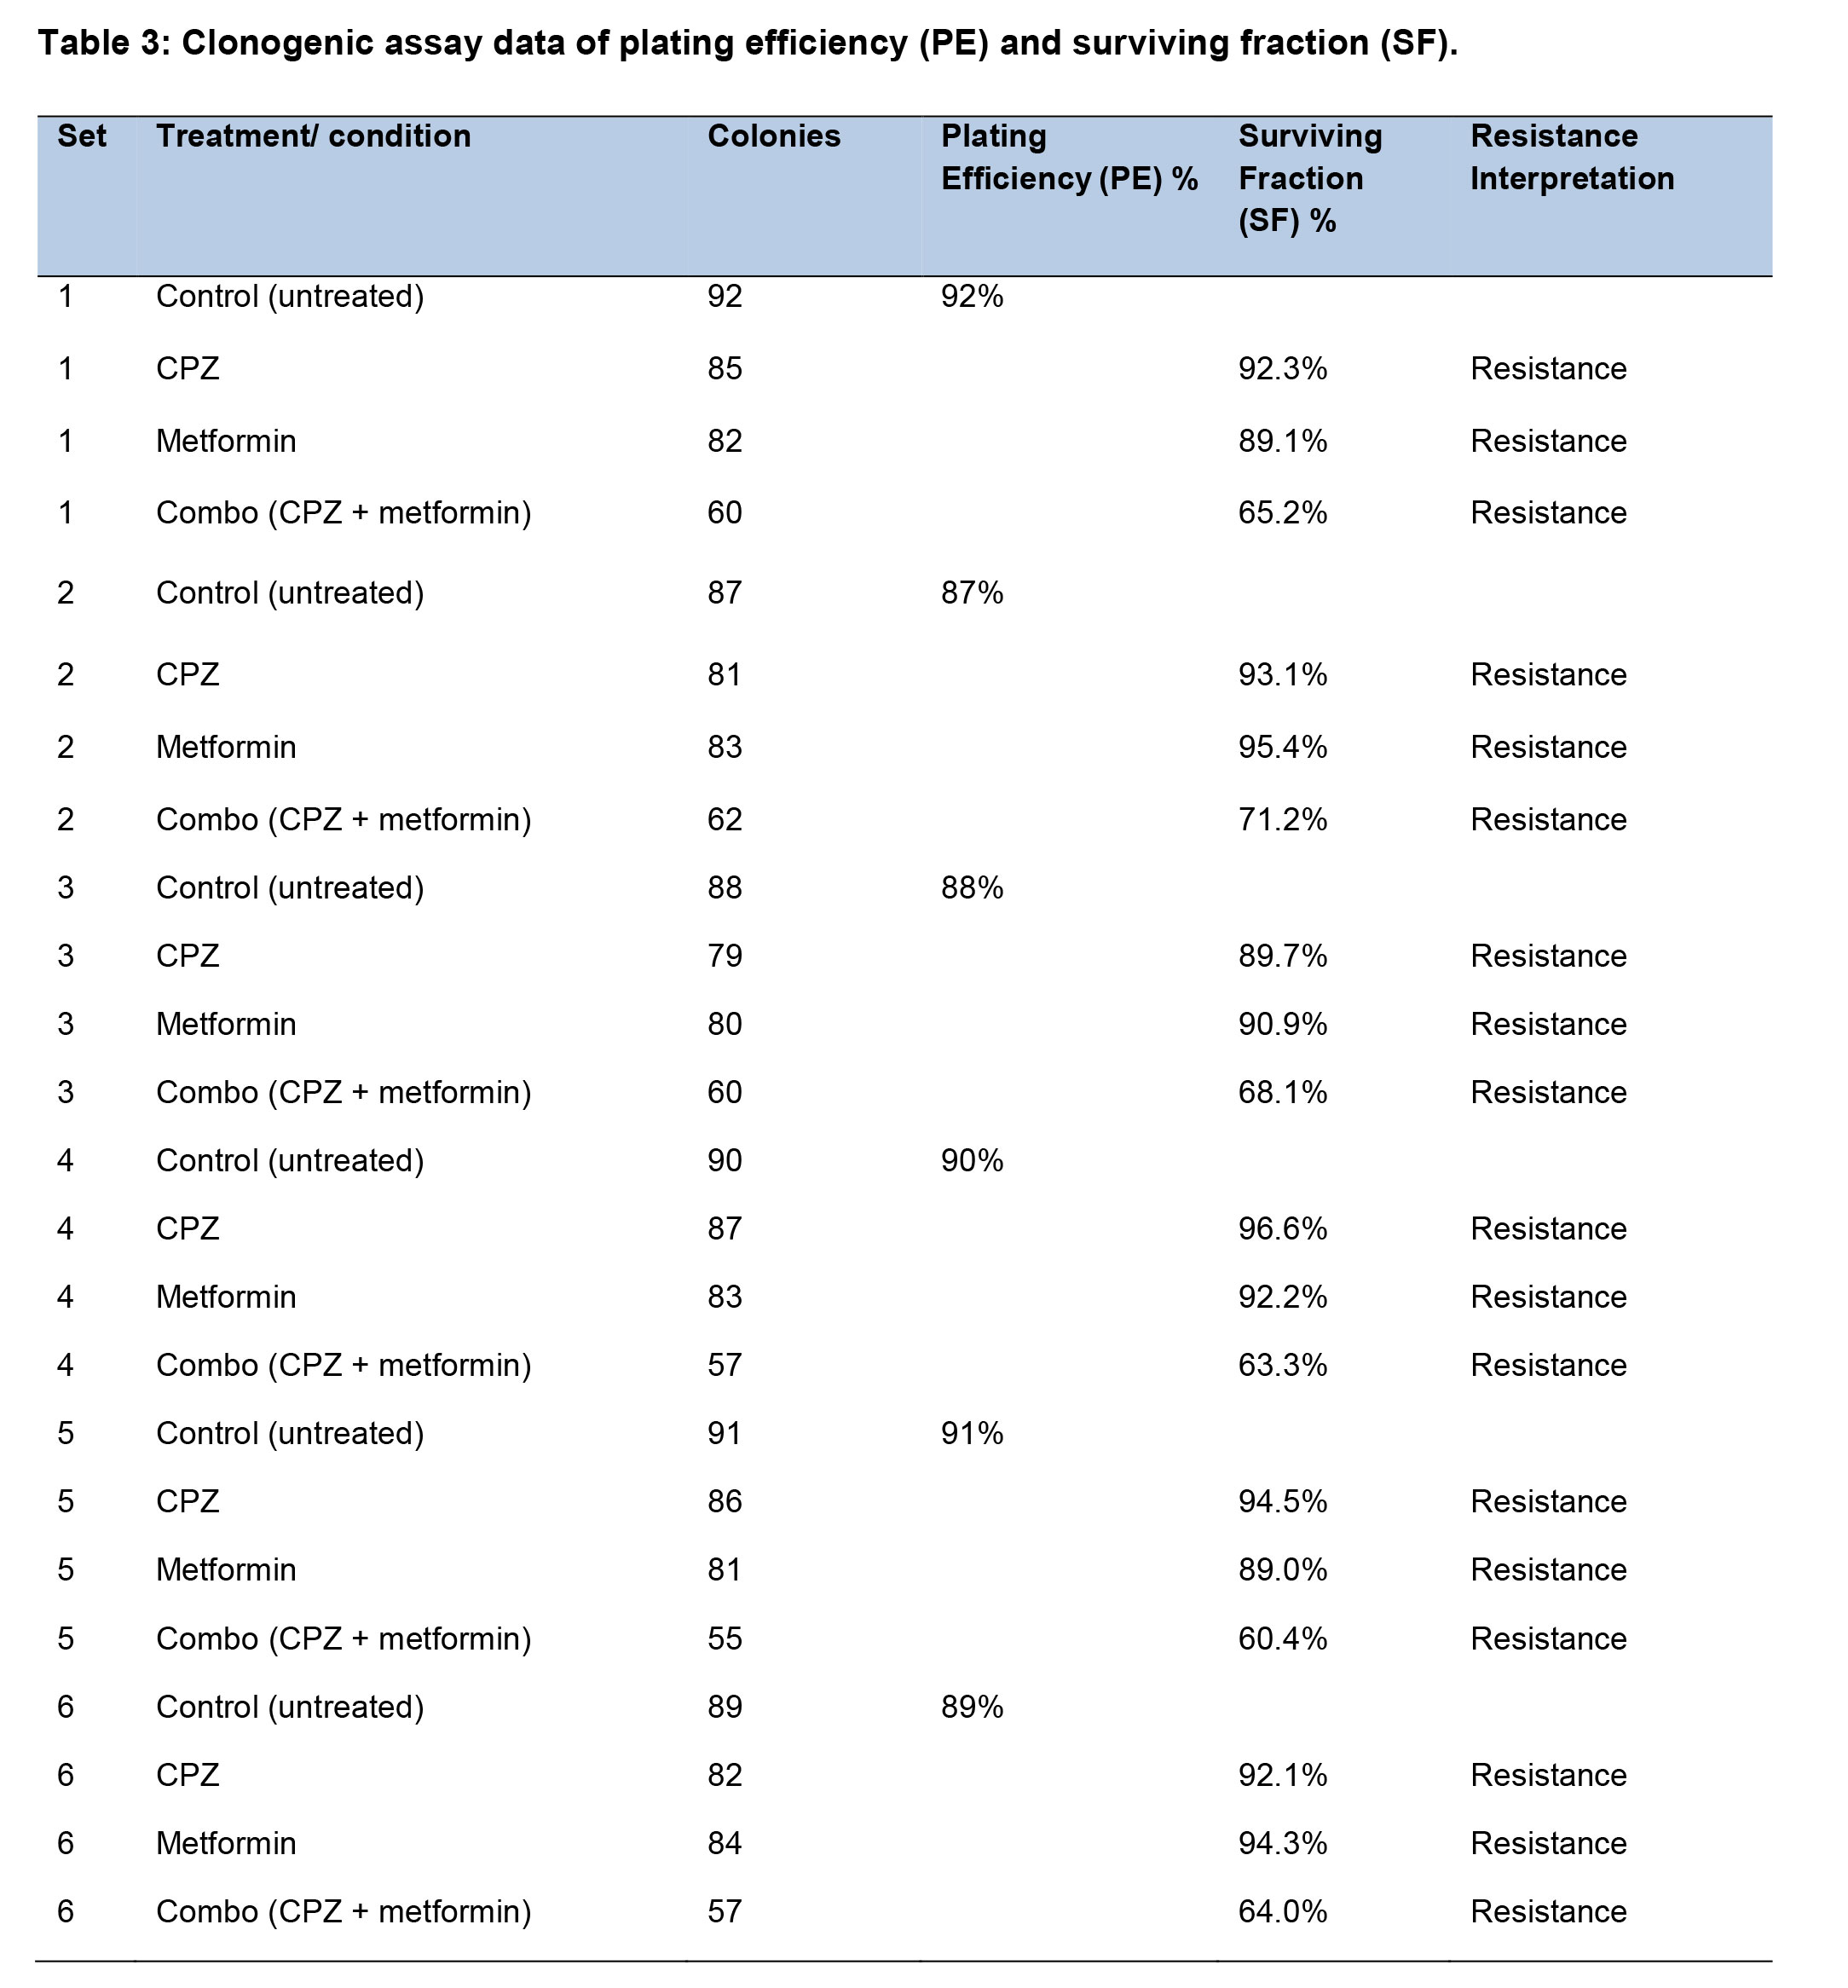
Interpretation of the SF%, the most effective treatment was the combo (CPZ + metformin) in set 1 (65.2%), set 2 (71.2%), set 3 (68.1%), set 4 (63.3%), set 5 (60.4%), and set 6 (64%). The clonogenic assay outcomes assess the drug response of OVCAR4 cells. For each set, the control (untreated) presented the seeded cells that formed the colonies to define the plating efficiency (PE) from 87% to 92%. Each treatment (CPZ, metformin and their combo) was calculated for surviving fraction (SF). Across all sets, single drug treatments (CPZ and metformin) displayed moderate reduction in SF ranging from 89% to 96.6%, indicating resistance. The combo generates a more noticeable SF reduction ranging from 60.4% to 71.2%. The Table 3 data provide a quantitative evaluation of drug resistance in this ovarian cancer model.
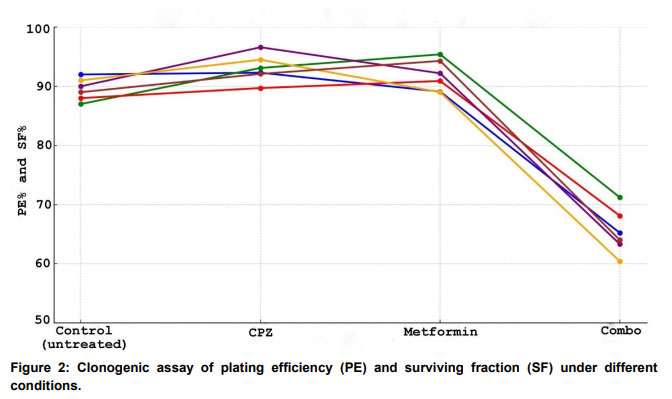
Figure 2 shows plating efficiency (PE %) for control (untreated) and surviving fraction (SF %) for drug treatments like CPZ, metformin, and their combo across different sets. Each line represents a set, making it easy to compare. The trend clearly shows that combo treatment (CPZ + metformin) outcomes have the lowest SF across all OVCAR4 cell line sets, presenting the strong reduction in cell survival compared to single treatments (CPZ and metformin). The PE of controls (untreated) across all sets was almost consistent. The trend lines presented in Figure 2 are shown in different colors, like set 1 (blue), set 2 (green), set 3 (red), set 4 (purple), set 5 (orange), and set 6 (brown). Figure 2 was generated from the original data in Table 3 using GraphPad Prism plotting software.
The colony data from the clonogenic assay were used for statistical analysis using ANOVA.
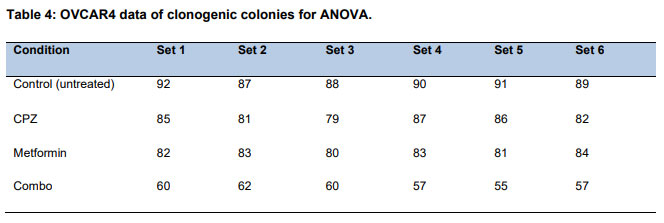
The significant differences between the four condition sets were revealed through one-way ANOVA. The F-value was 200.69, while the p-value was 4.3 × 10⁻¹⁵. The control (untreated) achieved the highest mean value of 89.5. The drug condition like CPZ, had a mean value of 83.3 and metformin had a mean value of 82.2. The combo mean value was 58.5 with high reduction and a strong synergistic effect. Generally, outcomes presented that the combo was more effective as compared to the individual drug.
The GraphPad Prism software was used to perform the ANOVA, followed by the Tukey’s HSD post hoc test.
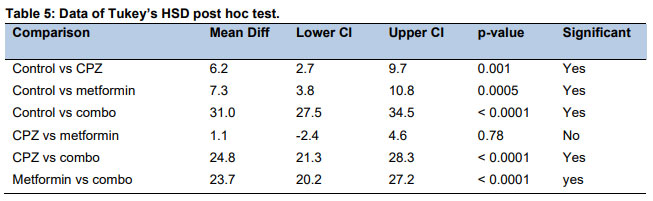
The Tukey’s test was executed to define the condition sets, described in Table 5. The outcomes for the control (untreated) comparison with CPZ (p-value = 0.001), metformin (p value = 0.0005) and combo (p-value = < 0.0001) were significant. The CPZ comparison with metformin (p value = 0.78) was not significant. While CPZ and metformin comparison with combo was also significant. Though, the combo had a strong inhibitory effect compared to the individual or control (untreated). The lower CL (confidence limit) was the lower bound and upper CL (confidence limit) was the upper bound for the mean difference between two sets.
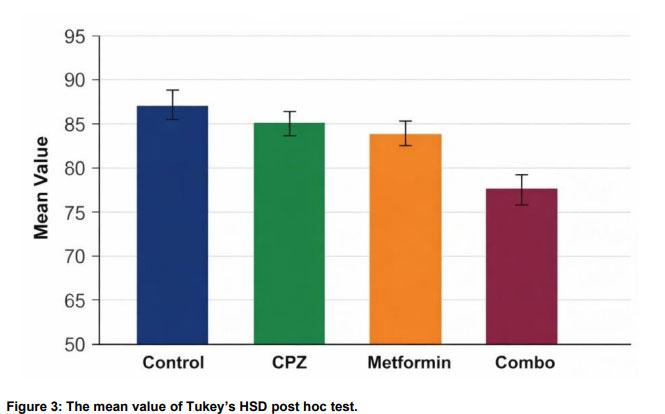
The graph presents the mean values of four condition sets. The control (untreated) set had the highest mean, but CPZ and metformin showed moderate reduction. The combo had a lowest mean and a strong synergistic effect. Figure 3 visually confirmed that the combo was more effective than other sets. Figure 3 was generated from the original data presented in Table 5 using GraphPad Prism plotting software.
For molecular analysis, further investigated the resistance pattern. The only combo of each set was used to extract the genomic RNA and relied on real-time PCR amplification and confirmed successful amplification via gel electrophoresis.
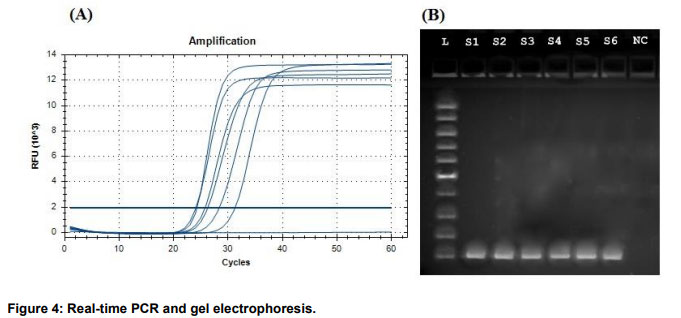
The present study delivers an inclusive assessment for the molecular mechanism in the OVCAR4 cell line, and the functional assay also confirmed it has significantly more resistance. The repurposing of drugs CPZ and metformin improved the effects. Figure 4 of (A) real-time PCR successfully amplified the sample, while (B) gel electrophoresis confirmed the expected size. The L is a ladder, while NC is negative control. The only combo of each set sample (S) was used for molecular analysis and in gel electrophoresis presented in S1, S2, S3, S4, S5 and S6.
Discussion
In ovarian cancer treatment, drug resistance is the main issue. The cancer cells ability to survive and proliferate despite the management of drugs that were primarily effective. The cause of chemoresistance in ovarian cancer is due to recurrence and poor prognosis. In ovarian cancer, drug resistance remains a basic challenge, particularly in HGSOC, where recurrence and chemoresistance are expressively narrow for long-term therapeutic success [20].
Drug resistance can be key where cancer cells are unresponsive to a drug. The impact of CPZ, metformin and the combo (CPZ + metformin) on the ovarian cancer cell line was evaluated. The OVCAR4 cells demonstrated sensitivity, while combo (CPZ + metformin) enhanced the reduction of colony formation. The synergy initially showed potential in overcoming resistance and the outcome displayed that the combo improved the efficacy by targeting resistance. So this strategy was initially helpful against drug resistance.
In OVCAR4 cell treatment, drug resistance remains one of the major challenges. The resistance is linked with drug efflux and may also be changing in DNA damage repair or multidrug resistance linked to genes. So allow the cancer cells to survive and proliferate despite treatment. The cellular and molecular analysis plays the key role in understanding the drug resistance mechanism in ovarian cancer cells [21].
In the current study, the initial stage in the hemocytometer and clonogenic assay exposed a critical inhibitory effect of drug treatment for colony formation of OVCAR4 cells. Though, after long observation, surviving cells resumed growth and demonstrated a recovery, showing the emergence of drug resistance. After 48 hours of drug treatment, aliquots of the suspended cells were separately used for hemocytometer counting and RNA extraction, while the remaining cells were reseeded into P100 corning plates for clonogenic assays to assess colony formation. This approach was sequentially justified as hemocytometer and clonogenic assay provide phenotypic evidence of cell counting, long term cell survival and proliferation under drug pressure and further investigated on ANOVA and Tukey’s HSD post hoc test for statistical analysis. While no significant change in resistance-related sequence of the gene was detected by real-time PCR, the expected band size was achieved via gel electrophoresis. Together, these outcomes indicate drug resistance in OVCAR4 cells.
Conclusion
This study provides important understanding of the drug resistance mechanism in the ovarian cancer cell line OVCAR4 and describes the potential of drug repurposing to improve the treatment efficacy. The OVCAR4 cell line was tested with CPZ and metformin to demonstrate a clear sign of chemoresistance. The hemocytometer and clonogenic assay confirmed the phenotypic drug response, for statistical analysis used ANOVA to follow the Tukey’s HSD post hoc test, and molecular approach via real-time PCR and gel electrophoresis. Importantly, the CPZ and metformin combination showed an improved inhibitory response in the initial phase, while later surviving ovarian cancer cells proliferated normally. The finding tells us that non-oncologic drugs are effective in the initial stage to overcome the drug resistance in ovarian cancer, but for later stages, need to find new paths and this outcome will be helpful for future study. The integration of cellular and a molecular approach provides a new venue to support future drug resistance monitoring and improved personalized therapeutic strategies for ovarian cancer.
References
- Ramraj SK, Elayapillai SP, Pelikan RC, Zhao YD, Isingizwe ZR, Kennedy AL, Lightfoot SA, Benbrook DM. Novel ovarian cancer maintenance therapy targeted at mortalin and mutant p53. Int J Cancer. 2020;147:1086-97. https://doi.org/10.1002/ijc.32830.
- Holý P, Hlaváč V, Šeborová K, Šůsová S, Tesařová T, Rob L, Hruda M, Bouda J, Bartáková A, Mrhalová M, Kopečková K, Al Obeed Allah M, Špaček J. Targeted DNA sequencing of high-grade serous ovarian carcinoma reveals association of TP53 mutations with platinum resistance when combined with gene expression. Int J Cancer. 2024;155:104-16. https://doi.org/10.1002/ijc.34908.
- Zhao R, Ning X, Lu H, Xu W, Ma J, Cheng J, Ma R. XTP8 Promotes Ovarian Cancer Progression by Activating AKT/AMPK/mTOR Pathway to Regulate EMT. Cell Biochem Biophys. 2024;82:945-57. https://doi.org/10.1007/s12013-024-01246-4.
- Yuan Q, Lv N, Chen Q, Shen S, Wang Y, Tong J. Application of single cell sequencing technology in ovarian cancer research (review). Funct Integr Genomics. 2024;24:144. https://doi.org/10.1007/s10142-024-01432-w.
- Xu J, Lu W, Wei X, Zhang B, Yang H, Tu M, Chen X, Wu S, Guo T. Single-cell transcriptomics reveals the aggressive landscape of high-grade serous carcinoma and therapeutic targets in tumor microenvironment. Cancer Lett. 2024;593:216928. https://doi.org/10.1016/j.canlet.2024.216928.
- Giudice E, Huang TT, Nair JR, Zurcher G, McCoy A, Nousome D, Radke MR, Swisher EM, Lipkowitz S, Ibanez K, Donohue D, Malys T, Lee MJ, et al. The CHK1 inhibitor prexasertib in BRCA wild-type platinum-resistant recurrent high-grade serous ovarian carcinoma: a phase 2 trial. Nat Commun. 2024;15:2805. https://doi.org/10.1038/s41467-024-47215-6.
- Domcke S, Sinha R, Levine DA, Sander C, Schultz N. Evaluating cell lines as tumour models by comparison of genomic profiles. Nat Commun. 2013;4:2126. https://doi.org/10.1038/ncomms3126.
- Beaufort CM, Helmijr JC, Piskorz AM, Hoogstraat M, Ruigrok-Ritstier K, Besselink N, Murtaza M, van IJcken WF, Heine AA, Smid M, Koudijs MJ, Brenton JD, Berns EM, Helleman J. Ovarian cancer cell line panel (OCCP): clinical importance of in vitro morphological subtypes. PLoS One. 2014;9(9):e103988. https://doi.org/10.1371/journal.pone.0103988.
- Zhong F, Zhu T, Pan X, Zhang Y, Yang H, Wang X, Hu J, Han H, Mei L, Chen D, Wang K, Zhou X, Li X, Dong. Comprehensive genomic profiling of high-grade serous ovarian carcinoma from Chinese patients identifies co-occurring mutations in the Ras/Raf pathway with TP53. Cancer Med. 2019;8:3928-35. https://doi.org/10.1002/cam4.2243.
- Bradbury A, O’Donnell R, Drew Y, Curtin NJ, Sharma Saha S. Characterisation of Ovarian Cancer Cell Line NIH-OVCAR3 and Implications of Genomic, Transcriptomic, Proteomic and Functional DNA Damage Response Biomarkers for Therapeutic Targeting. Cancers. 2020;12(7):1939. https://doi.org/10.3390/cancers12071939.
- Ereku LT, Mackay RE, Craw P, Naveenathayalan A, Stead Branavan M, Balachandran W. RPA using a multiplexed cartridge for low cost point of care diagnostics in the field. Anal Biochem. 2018;547:84-88. https://doi.org/10.1016/j.ab.2018.02.010.
- Iqbal F, Asif MS, Qureshi AG, Shah JA, Abdikaxarovich SA, Adil MN, Hussain A. RPA-Based colorimetric detection of SARS-Cov-2 (Covid-19) and its physiological effects. Int J Health Sci. 2023;6 (S7):6804-6818. https://doi.org/10.53730/ijhs.v6nS7.13862.
- Naveed AM, Royaidar J, Wadie YRR, GonzagaLeong-on MS, Iqbal F, Hussain A, Ali Q, Rasheed A. Epidemiology and Resistance Pattern in Microbial Pneumonia: A Review. Pak J Health Sci. 2022;3:27-31. https://doi.org/10.54393/pjhs.v3i05.229.
- Iqbal F. Enhancing the effectiveness of Chimeric Antigen Receptor (CAR) T cells against tumors through CRISPR/Cas9-mediated PD-1 disruption. Int J Health Sci. 2023;7:1836-50. https://doi.org/10.53730/ijhs.v7nS1.14397.
- Iqbal F. CRISPR/Cas9-based manipulation of oncogenic chromosomal changes in vivo and drug impact on blood pressure. Int J Health Sci. 2023;7:2130-39. https://doi.org/10.53730/ijhs.v7nS1.14461.
- Gockley A, Melamed A, Bregar AJ, Clemmer JT, Birrer M, Schorge JO, Del Carmen MG, Rauh-Hain JA. Outcomes of Women with High-Grade and Low-Grade Advanced-Stage Serous Epithelial Ovarian Cancer. Obstet Gynecol. 2017;129:439-47. https://doi.org/10.1097/AOG.0000000000001867.
- Garziera M, Cecchin E, Canzonieri V, Sorio R, Giorda G, Scalone S, De Mattia E, Roncato R, Gagno S, Poletto E, Romanato L, Sartor F, Polesel J, Toffoli G. Identification of Novel Somatic TP53 Mutations in Patients with High-Grade Serous Ovarian Cancer (HGSOC) Using Next-Generation Sequencing (NGS). Int J Mol Sci. 2018;19(5):1510. https://doi.org/10.3390/ijms19051510.
- Iqbal F. Bridging clinical insight and laboratory model in high-grade serous ovarian carcinoma (HGSOC) using DNA sequencing-based profiling of TP53. Oncoscience. 2025;12:168-174. https://doi.org/10.18632/oncoscience.632.
- Iqbal F. Pharmacological Reinvention: Drug Repurposing Strategies to Tackle Aggressive High Grade Serous Ovarian Carcinoma (HGSOC). J Cancer Sci Clin Ther. 2025;9:189-198. https://doi.org/10.26502/jcsct.5079276.
- Iqbal F. Developing Synergistic Therapeutic Strategy to Uncover Enhanced Anti-Tumor Efficacy in High-Grade Serous Ovarian Carcinoma (HGSOC). Int J Pharm Integr Health Sci. 2026;7:19-28. https://doi.org/10.56536/ijpihs.v7i1.284.
- Iqbal F. A low-cost color sensor device for rapid detection of high-grade serous ovarian carcinoma (HGSOC). Oncoscience. 2026 Mar 11;13:104-114. https://doi.org/10.18632/oncoscience.652.